
On the projects I’ve worked on, the SIL study is one of the most misunderstood deliverables in the whole functional safety lifecycle. People treat it as a single document, a box to tick before the SIS gets ordered. It isn’t. A SIL assessment is actually two or three distinct engineering activities stitched together, each answering a different question, each needing different inputs, and each failing in a different way when it’s rushed.
I’ve sat in enough HAZOP and LOPA sessions, and reviewed enough SIL verification reports from safety system vendors, to have seen most of the ways this work goes wrong. This guide is my attempt to explain what the work really is — determination, verification, and validation — in the words an engineer would actually use on site, rather than the marketing language you get from the consultancies that sell them.
If you’ve read our Safety Instrumented System guide and SIL ratings guide, this article is the next layer down: how the SIL numbers are actually derived and proven on a real project.
TL;DR — Quick Answer: What Is a SIL Study?
A SIL study is the formal process of determining the required Safety Integrity Level for each Safety Instrumented Function in a plant, and then proving that the designed function actually achieves that level. It is carried out under IEC 61511 (the process-sector standard) and IEC 61508 (the underlying standard), and it is a core part of the functional safety lifecycle.
A SIL study is normally split into three stages. SIL determination (also called SIL assessment or SIL allocation) decides what SIL each Safety Instrumented Function needs, usually through Layer of Protection Analysis (LOPA) or a risk graph. SIL verification proves, by calculating the Probability of Failure on Demand (PFD), that the chosen sensors, logic solver, and final elements meet the target SIL. SIL validation confirms, through testing, that the installed system does what the Safety Requirements Specification says.
Key points:
- It applies to Safety Instrumented Functions, not to the whole plant at once
- SIL determination sets the target; SIL verification proves the design meets it
- LOPA is the most common determination method in the process industries
- Verification is a quantitative PFD calculation against IEC 61508 tables
- Architectural constraints (HFT, SFF) must be satisfied as well as the PFD target
- The Safety Requirements Specification (SRS) is the bridge between the stages
- The study is a lifecycle activity, revisited at every major change
What You Will Learn
This guide covers the SIL study at the depth a working process control or safety engineer actually needs:
- What a SIL study is and how the three stages fit together
- How SIL determination works, with LOPA and risk graph methods compared
- How SIL verification calculates PFD and checks architectural constraints
- Where the Safety Requirements Specification fits in the lifecycle
- How the major SIS platforms support SIL verification
- The common mistakes that undermine the work on real projects
What a SIL Study Actually Is: The Three Stages
The phrase “SIL study” gets used loosely. On some projects it means only the determination workshop. On others it means the vendor’s verification report. In reality a complete study spans three activities, and confusion between them causes real problems.
Stage 1 — SIL determination. This answers the question: how much risk reduction does each Safety Instrumented Function have to provide? It is a risk assessment activity, done by a multidisciplinary team, usually after the HAZOP. The output is a target SIL (1, 2, 3, or occasionally 4) for each SIF.
Stage 2 — SIL verification. This answers a different question: does the equipment we’ve chosen actually achieve that target? It is a calculation activity, done by a safety engineer using failure-rate data and the PFD equations from IEC 61508. The output is a verified PFD figure and a pass or fail against the target.
Stage 3 — SIL validation. This is the proof at the end: does the installed, configured system behave exactly as the Safety Requirements Specification demands? It is a testing activity, done during FAT and SAT. The output is a signed validation report.
The mistake I see most often is treating determination and verification as the same thing. They are not. Determination can say a function needs SIL 2, and verification can then show the proposed design only reaches SIL 1 — which means the design has to change, not the target. Keeping these stages separate in your head is the single most useful discipline in the whole exercise.
For the foundational context on the systems these studies apply to, see our What Is a DCS guide.
SIL Determination — Setting the Target
SIL determination is where the target SIL for each Safety Instrumented Function is decided. It follows the hazard identification work, so it depends heavily on a good HAZOP. The team looks at each hazardous scenario the SIF is meant to protect against and works out how much risk reduction is actually required.
The inputs you need
A determination session cannot start from nothing. The team needs the HAZOP worksheets, the cause-and-effect scope, the tolerable risk criteria the operating company has set, and a reasonable picture of the independent protection layers already in place. On the projects I’ve been on, the HAZOP quality is the biggest single driver of whether determination goes smoothly or turns into a week of arguments.
For the upstream hazard studies that feed determination, see our HAZOP and LOPA guide.
Layer of Protection Analysis (LOPA)
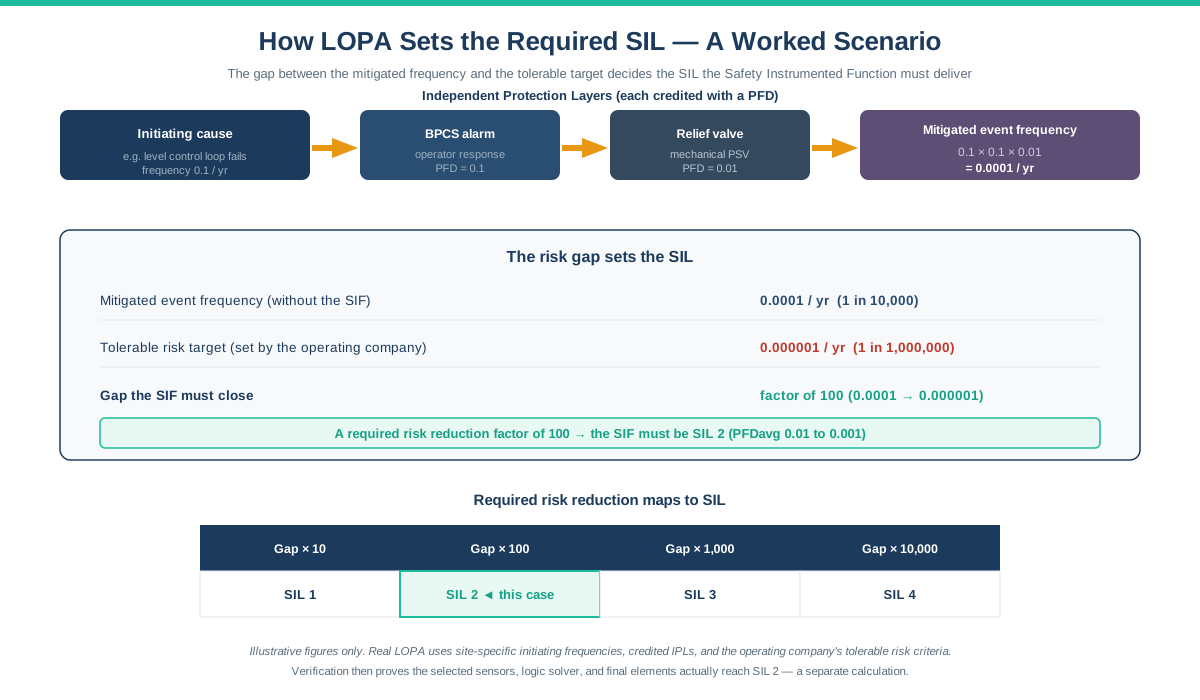
LOPA is the most common SIL determination method in oil and gas, refining, and petrochemicals. It is a semi-quantitative technique. For each hazardous scenario, the team estimates the frequency of the initiating cause, then credits each independent protection layer with a probability of failure on demand, and multiplies through to get a mitigated event frequency.
If that mitigated frequency is still higher than the tolerable target, the gap has to be closed by the Safety Instrumented Function. The size of that gap sets the required SIL. A gap of a factor of 100 points to SIL 2; a factor of 1,000 points to SIL 3. The structure of LOPA makes the logic auditable, which is why regulators and operating companies favour it.
Risk graphs and risk matrices
IEC 61511 also allows qualitative methods. A risk graph walks the team through a series of parameters — consequence severity, frequency of exposure, possibility of avoiding the hazard, and demand rate — and arrives at a SIL band. A risk matrix is similar, mapping severity against likelihood.
These methods are faster than LOPA and useful for screening, but they are coarser. In my experience they tend to be conservative, pushing functions to a higher SIL than LOPA would. On projects with hundreds of SIFs, teams often screen with a risk graph and then apply LOPA to the ones that land at SIL 2 or above.
Determination methods compared
| Method | Type | Strength | Weakness |
|---|---|---|---|
| LOPA | Semi-quantitative | Auditable, detailed, widely accepted | Slower; needs good data |
| Risk graph | Qualitative | Fast screening of many SIFs | Coarse; tends conservative |
| Risk matrix | Qualitative | Simple, familiar to teams | Least granular |
| Fully quantitative (FTA) | Quantitative | Highest rigour | Expensive; reserved for complex cases |
The output of determination is a target SIL for each SIF, documented so it can feed the next stage. That documentation becomes part of the Safety Requirements Specification.
The Safety Requirements Specification — The Bridge
Between determination and verification sits the Safety Requirements Specification, or SRS. It is easy to skip past, but it is the document that makes the rest of the SIL study possible. The SRS records what each Safety Instrumented Function must do, in enough detail that it can be designed, verified, and validated.
A good SRS captures the safe state, the process safety time, the required SIL, the trip setpoints, the required response time, the demand mode, and the proof test interval. Without these, verification has no target to calculate against and validation has no criteria to test. On the projects I’ve reviewed, a thin SRS is the single most reliable predictor of trouble later in the project.
The SRS also connects to the wider control and automation design. The way setpoints, interlocks, and operator interfaces are handled links directly to alarm management under ISA-18.2 and to HMI presentation under ISA-101.
SIL Verification — Proving the Design Meets the Target
SIL verification is the stage people most often mean when they talk about “the SIL report”. It is the quantitative proof that the equipment chosen for a Safety Instrumented Function actually delivers the SIL that determination required. It is where the maths lives.
The PFD calculation
For a low-demand function — which covers most process SIFs — the metric is the average Probability of Failure on Demand, or PFDavg. Each SIL band corresponds to a range of PFDavg. SIL 1 means a PFDavg between 0.1 and 0.01, SIL 2 between 0.01 and 0.001, and SIL 3 between 0.001 and 0.0001. A smaller PFDavg means a more reliable function.
Verification calculates the PFDavg for the complete function — sensors, logic solver, and final elements in series — and compares it against the target band. Each subsystem contributes, and because they are in series, the weakest subsystem usually dominates. On most of the functions I’ve seen verified, the final elements, meaning the valves, are the biggest contributor to PFD.
PFDavg bands by SIL
| SIL | PFDavg range | Risk reduction factor |
|---|---|---|
| SIL 1 | 0.1 to 0.01 | 10 to 100 |
| SIL 2 | 0.01 to 0.001 | 100 to 1,000 |
| SIL 3 | 0.001 to 0.0001 | 1,000 to 10,000 |
| SIL 4 | 0.0001 to 0.00001 | 10,000 to 100,000 |
SIL 4 is almost never seen in the process industries; it is extraordinarily difficult to achieve and usually signals that the risk should be reduced by other means.
What drives the PFD number
Several factors move the PFD. The failure rate of each device, taken from manufacturer safety data or a recognised database. The proof test interval, because a longer interval between tests lets undetected dangerous failures accumulate. The diagnostic coverage of the logic solver. And the voting architecture — a 2oo3 arrangement tolerates a single failure where a 1oo1 arrangement does not.
This is where the proof test interval in the SRS comes back. Stretching a proof test from one year to three years can push a function from passing to failing verification. The verification calculation and the maintenance plan are tied together, and treating them separately is a classic error.
Architectural constraints — HFT and SFF
Meeting the PFD target is necessary but not sufficient. IEC 61508 also imposes architectural constraints through the Hardware Fault Tolerance (HFT) and the Safe Failure Fraction (SFF). HFT is how many dangerous failures a subsystem can tolerate and still perform its safety function. SFF is the proportion of failures that are either safe or detected.
Together these set a minimum architecture for a given SIL, independent of the PFD maths. A function can pass the PFD calculation and still fail the architectural constraint, which forces a change such as adding redundancy. Both tests have to pass for the function to be verified. Skipping the architectural check is one of the most common gaps I find when reviewing a vendor’s SIL study.
How the Major SIS Platforms Support SIL Verification
SIL verification is a calculation, not a platform feature, but the choice of safety logic solver matters because its certified failure data and diagnostic coverage feed directly into the numbers. The major process-safety platforms all carry IEC 61508 certification, typically up to SIL 3 for a single system.
Yokogawa ProSafe-RS is the safety counterpart to CENTUM VP, sharing engineering and operation environments with the DCS while remaining a physically separate, certified SIS. Its tight integration with CENTUM is a major reason it appears on so many oil and gas and LNG projects. For the DCS side, see our Yokogawa CENTUM VP guide.
Triconex, from Schneider Electric, uses a Triple Modular Redundant (2oo3) architecture that gives high availability and fault tolerance. It has a long track record in high-integrity applications and is common on both safety and fire-and-gas duties.
Honeywell Safety Manager is the SIS that pairs with Experion PKS, integrating closely with the DCS environment while keeping safety and control separate. For the DCS side, see our Honeywell Experion PKS guide.
Emerson DeltaV SIS uses a smart logic solver approach with electronic marshalling, integrating with the DeltaV environment. For the DCS side, see our Emerson DeltaV guide.
Whichever platform is used, the verification principle is the same: the logic solver’s certified data is one input among three, and the sensors and final elements usually matter more to the final PFD.
SIL Validation — The Final Proof
SIL validation is the last stage and the one most tied to commissioning. It confirms that the installed, configured Safety Instrumented System does exactly what the Safety Requirements Specification says — the right setpoints, the right voting, the right response time, the right safe state.
Validation happens through structured testing, primarily during Factory Acceptance Testing and Site Acceptance Testing. Every SIF is exercised against its SRS, including the fault conditions, the bypass handling, and the reset logic. On the projects I’ve worked, thorough FAT validation is where most configuration errors are caught; the ones missed there are far more expensive to fix at site.
Validation is not a one-time event. Under the lifecycle model of IEC 61511, the study is revisited whenever the process changes, whenever a SIF is modified, and at periodic functional safety audits. A SIL study is a living set of documents, not a deliverable you file and forget.
Common SIL Study Mistakes
Based on project experience and on reviewing others’ work, here are the recurring mistakes worth watching for:
Confusing determination with verification. Treating the target SIL and the achieved SIL as the same number. When verification fails, the design must change; the target does not get quietly lowered to match.
A thin Safety Requirements Specification. Skipping process safety time, proof test interval, or response time in the SRS. Everything downstream then rests on assumptions, and verification calculates against a target that nobody agreed.
Ignoring the architectural constraints. Passing the PFD calculation but never checking HFT and SFF. A function can meet the PFD target and still be non-compliant on architecture.
Optimistic proof test intervals. Assuming a one-year proof test in the calculation, then maintenance planning a three-year interval. The verified SIL silently degrades, and nobody notices until an audit.
Over-crediting protection layers in LOPA. Claiming independence for layers that share a common element, or crediting the BPCS and the SIS as fully independent when they share sensors. This understates the required SIL.
Treating the logic solver as the whole function. Focusing on the certified SIS platform and underweighting the sensors and valves, which usually dominate the PFD. The final elements deserve the most attention, not the least.
Forgetting the lifecycle. Running the study once at the design stage and never revisiting it after plant changes. IEC 61511 is explicit that the study is revisited through the life of the plant.
Weak competency in the determination team. Running LOPA without someone who genuinely understands both the process and the method. The numbers that come out are only as good as the judgement that goes in.
Frequently Asked Questions
What is a SIL study?
A SIL study is the formal process of determining the required Safety Integrity Level for each Safety Instrumented Function in a plant, and then proving the design achieves it. It is carried out under IEC 61511 and IEC 61508 and spans three stages: SIL determination, SIL verification, and SIL validation.
What is the difference between SIL determination and SIL verification?
SIL determination sets the target — how much risk reduction each Safety Instrumented Function must provide — usually through LOPA or a risk graph. SIL verification proves the chosen equipment meets that target by calculating the Probability of Failure on Demand. Determination asks “how much is needed”; verification asks “does the design deliver it”.
What method is used for SIL determination?
The most common method in the process industries is Layer of Protection Analysis (LOPA), a semi-quantitative technique. Risk graphs and risk matrices (qualitative) are used for faster screening, and fully quantitative Fault Tree Analysis is reserved for complex cases. Many projects screen with a risk graph and apply LOPA to higher-SIL functions.
How is SIL verified?
SIL verification calculates the average Probability of Failure on Demand (PFDavg) for the complete Safety Instrumented Function — sensors, logic solver, and final elements in series — using device failure rates, proof test intervals, and voting architecture. The result is compared against the PFDavg band for the target SIL, and the architectural constraints (HFT and SFF) are checked separately.
What is PFD in SIL verification?
PFD is the Probability of Failure on Demand — the chance that a Safety Instrumented Function fails to act when it is needed. For low-demand functions the metric is the average, PFDavg. Each SIL corresponds to a PFDavg range: SIL 1 is 0.1 to 0.01, SIL 2 is 0.01 to 0.001, and SIL 3 is 0.001 to 0.0001.
What is the Safety Requirements Specification?
The Safety Requirements Specification (SRS) is the document that records what each Safety Instrumented Function must do: the safe state, process safety time, required SIL, trip setpoints, response time, demand mode, and proof test interval. It sits between determination and verification and is the reference that both verification and validation work against.
What standards govern a SIL study?
The main standard is IEC 61511, which covers functional safety for Safety Instrumented Systems in the process industries. It sits on top of IEC 61508, the generic functional safety standard that defines the SIL concept and the architectural constraints. In the United States, ISA 84 is the national adoption of IEC 61511.
How often is a SIL study updated?
A SIL study is a lifecycle activity, not a one-time deliverable. Under IEC 61511 the work is revisited whenever the process changes, whenever a Safety Instrumented Function is modified, and at periodic functional safety audits. The determination, verification, and validation records are maintained through the operating life of the plant.
What is the difference between SIL and SIF?
A Safety Instrumented Function (SIF) is a specific protective function — for example, closing a valve when pressure exceeds a limit. The Safety Integrity Level (SIL) is the measure of how reliable that function must be. The study determines the SIL for each SIF and then verifies the SIF achieves it. For more on the systems that host these functions, see our Safety Instrumented System guide.
Conclusion
A SIL study is not a single document and it is not a formality. It is a disciplined chain of reasoning that runs from “how much risk reduction does this function need” through “does the design actually deliver it” to “does the installed system do what we specified”. Keeping those three stages — determination, verification, validation — clearly separate is the habit that makes the whole thing trustworthy.
The most important practical truths about a SIL study:
- Determination sets the target; verification proves the design; validation confirms the install
- LOPA is the workhorse determination method in the process industries
- Verification is a PFD calculation, and the final elements usually dominate the number
- Architectural constraints (HFT, SFF) must pass as well as the PFD target
- The Safety Requirements Specification is the bridge that makes the rest possible
- Proof test interval ties the calculation to the maintenance plan
- The study is revisited through the whole life of the plant, not filed once
If you’re new to functional safety, resist the temptation to see this as a report to be procured. It is an engineering activity your team owns, and the HAZOP quality, the LOPA judgement, and the SRS detail decide whether the final numbers mean anything. The maths is the easy part; the inputs are where the real work is.
For the foundations this guide builds on, see our Safety Instrumented System guide, SIL ratings guide, and HAZOP and LOPA guide. For the platforms that host these functions, see our Yokogawa CENTUM VP guide and Honeywell Experion PKS guide.
About the Author
Daniel Reed is an Instrument and Controls Engineer with 14+ years of oil and gas EPC experience across onshore and offshore projects in Asia and Africa. He currently works as a client-side I&C completion engineer on a large oil and gas mega-project in Asia, working with Honeywell Experion PKS and Safety Manager since 2018.
His earlier work covered Yokogawa CENTUM and Triconex SIS on an offshore brownfield in Africa, and Yokogawa CENTUM and ProSafe-RS on a gas-to-liquids facility in Africa. His focus is engineering deliverable review, control and safety system commissioning, HAZOP/SIL/SIF participation, FAT/SAT execution, and vendor coordination across Honeywell, Yokogawa, Triconex, Allen-Bradley, and Siemens platforms.